Transform data into charts with natural language
Got a CSV file? Simply chat with our tool and create a range of charts
All you need for smart data visualization
All the essential tools for quick and efficient chart creation from CSV data, focusing on the big picture rather than the tiny details
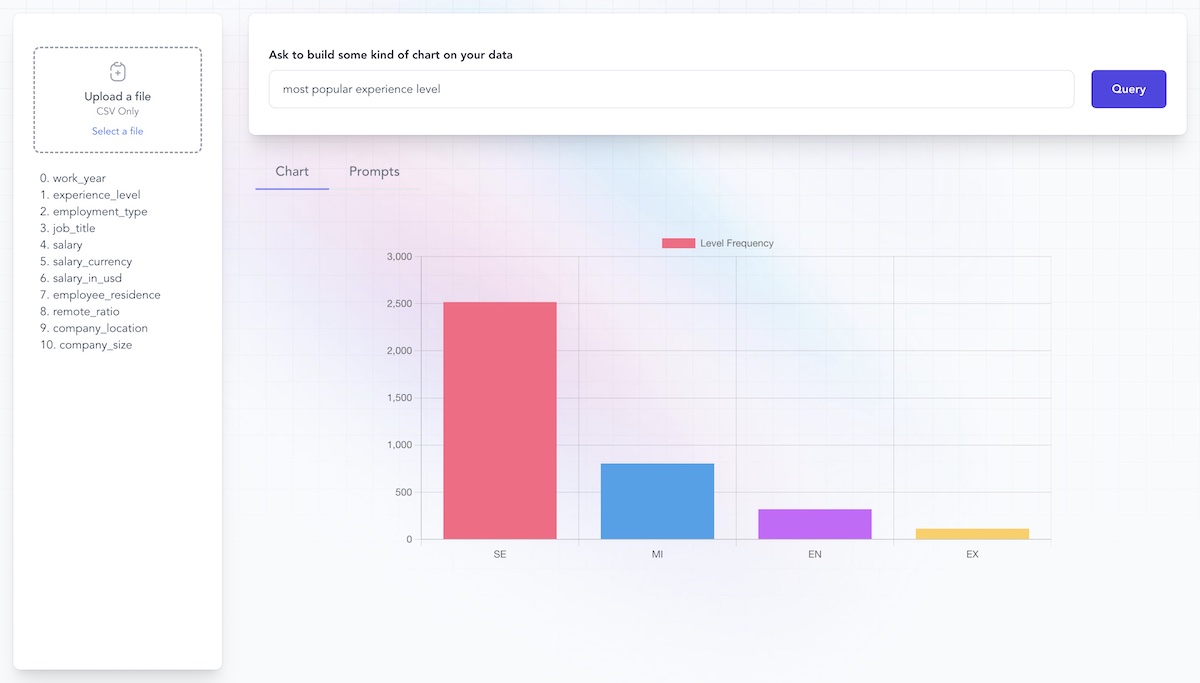
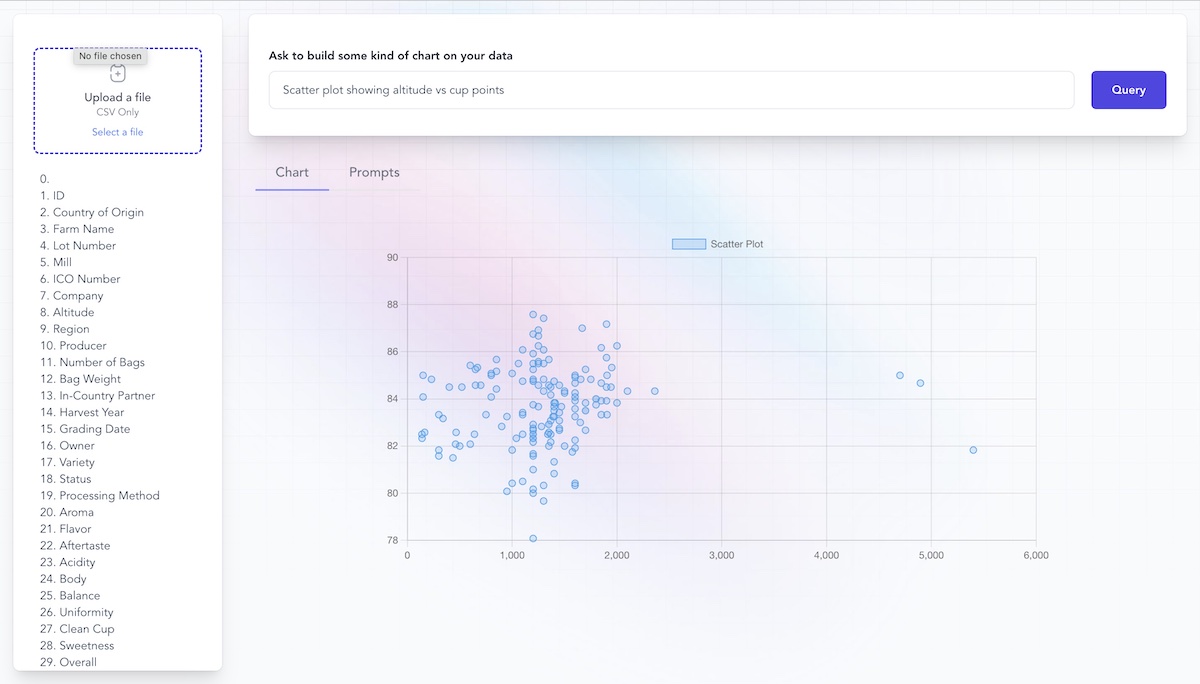
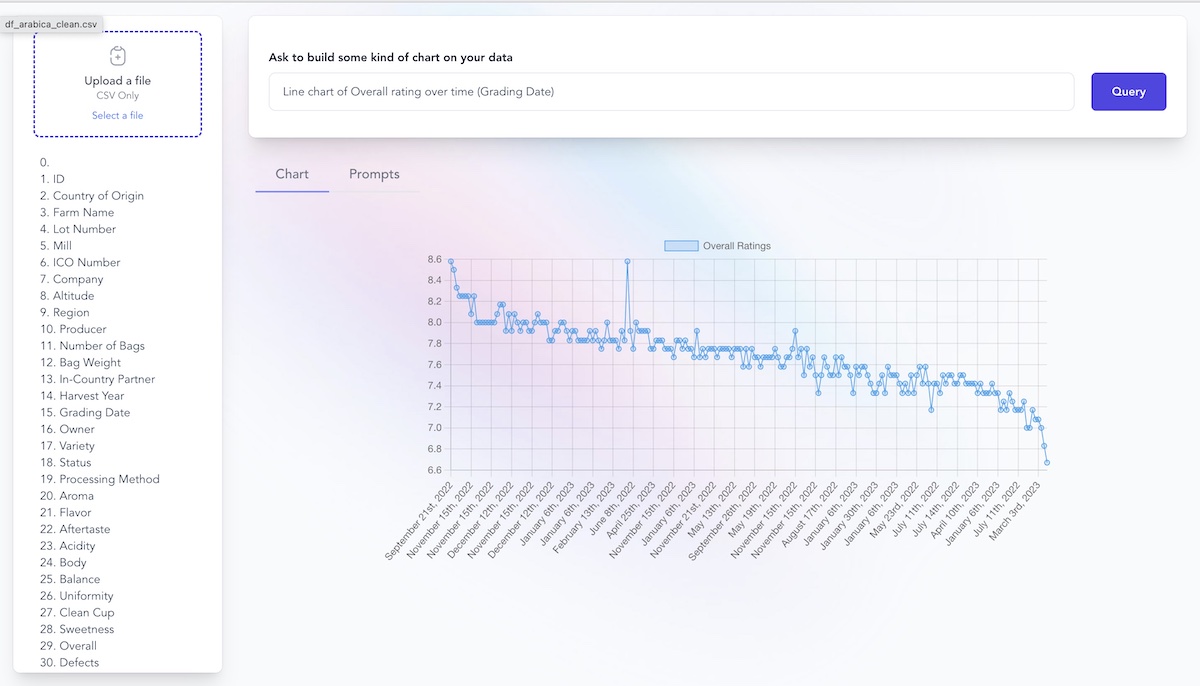
No need for complicated coding or scripting. Just tell the tool what you want in plain English, like 'create a bar chart of sales by region,' and watch your data come to life.
Streamline your data visualization tasks
Because who needs complications when you're working with data? We're here to simplify, not to add to your workload
Intuitiveness
Speak, Don't Code
Our platform understands your natural language instructions, saving you the time and effort of learning complex software or coding languages
Versatility
Never lose track of what’s in stock with accurate inventory tracking.
We don’t offer this as part of our software but that statement is inarguably true. Accurate inventory tracking would help you for sure.
Contacts
Organize all of your contacts, service providers, and invoices in one place.
This also isn’t actually a feature, it’s just some friendly advice. We definitely recommend that you do this, you’ll feel really organized and professional.
Speak, Don't Code
Our platform understands your natural language instructions, saving you the time and effort of learning complex software or coding languages
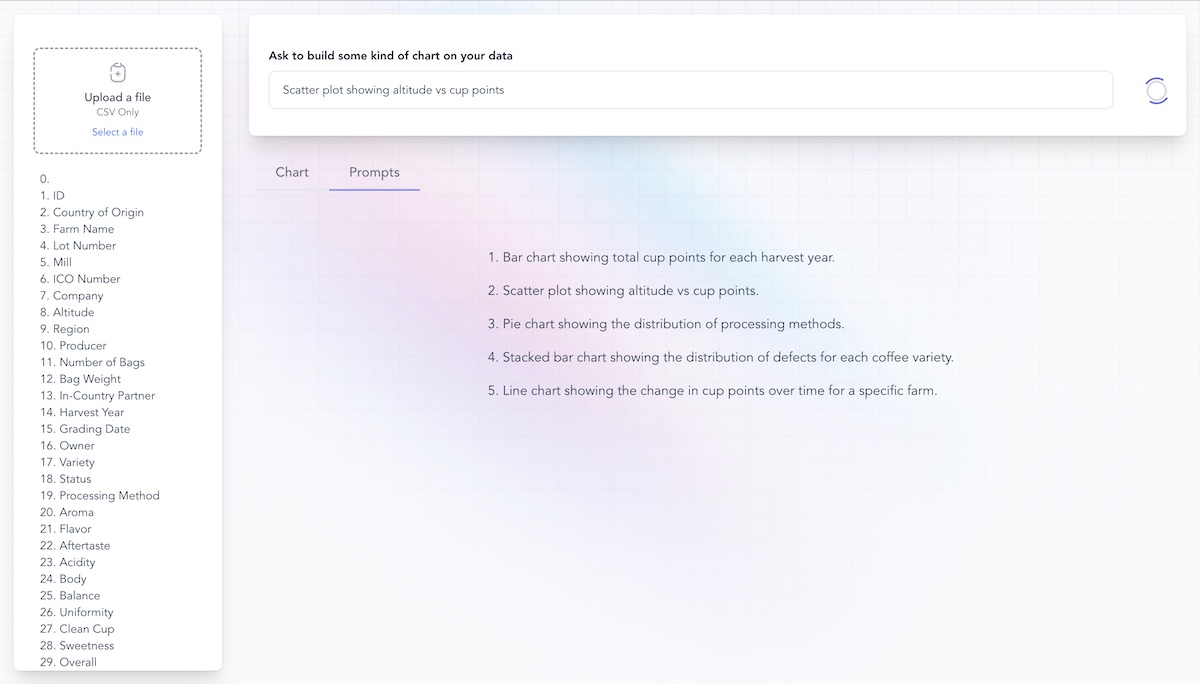
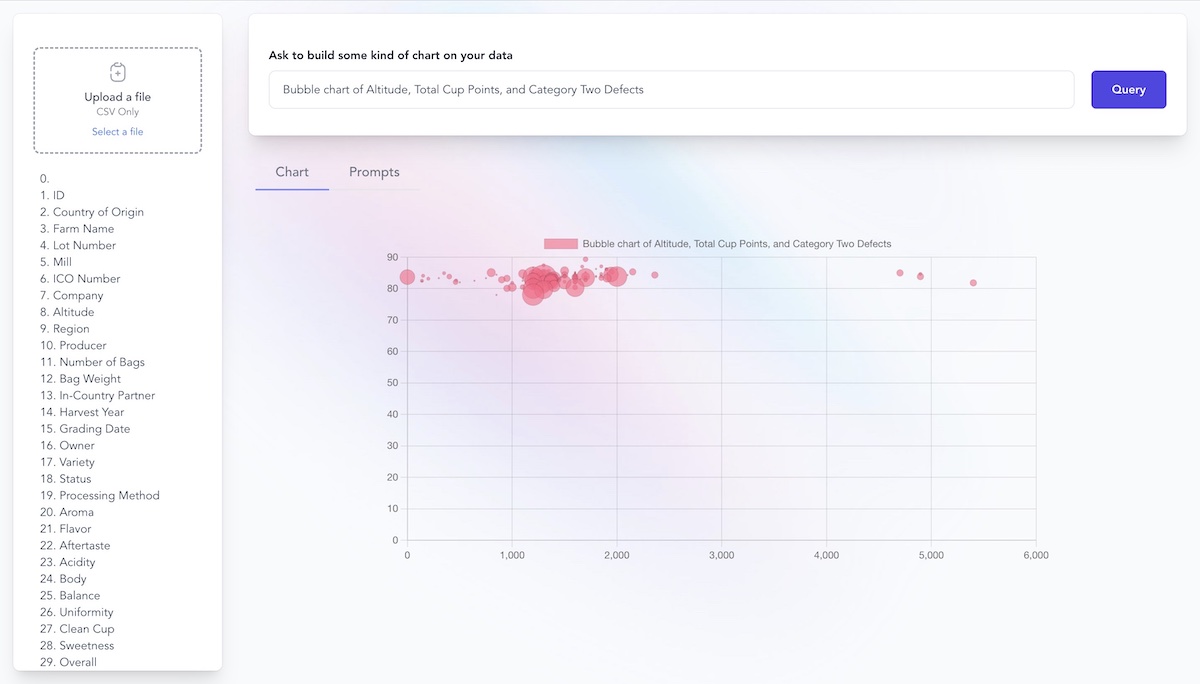
Chart Diversity at Your Fingertips
With an array of chart types at your disposal, you can create the most fitting visualizations for your data, be it a line graph, bar chart, or pie chart
Data Privacy Matters
We process only the necessary metadata on our servers while your actual data stays on your side, ensuring high-level privacy and data security
Get started today
It's time to harness the power of your data. Use our platform to turn raw numbers into visual insights and make data analysis feel less like a chore and more like a breeze
Try now for free 🚀Loved by businesses worldwide.
Our software is so simple that people can’t help but fall in love with it. Simplicity is easy when you just skip tons of mission-critical features.
This platform is so intuitive, it's hard to believe I'm actually creating complex data visualizations. It's a game-changer!
Sheryl BergeI never thought I'd say this, but data visualization has become the easiest part of my work. All thanks to this tool!
James Woods
I uploaded my CSV file and asked it to 'show me a pie chart of my sales by product'. The ease of use is mind-blowing!
Leland KiehnData analysis has always been daunting, but now it's almost fun. I just chat with the platform, and voila, I have my charts!
Erin Powlowski
It's incredibly reassuring to know that my data stays with me. Privacy is a big deal, and this platform respects that.
Peter RenoldsThe AI assistant is like a data scientist in my pocket. It suggests chart types that I hadn't even considered, which helps me see my data in new ways
Amy Hahn
Simple pricing, for everyone.
It doesn’t matter what size your business is, our software won’t work well for you.
Free Access
Start your data visualization journey today at no cost. Enjoy minor daily limitations and explore our robust features
$0
- 15 queries per hour
- 1 CSV file at a time
- 1MB file limit
- 5 AI prompts per file
Coming Soon - Premium Plan (Save 50%)
Unlock the full power of data visualization.
$15 (Pre-sale)
- 120 queries per hour
- Work with multiple CSV files
- 5MB file limit
- 100 AI prompts per file
- Secure cloud storage
Frequently asked questions
If you can’t find what you’re looking for, email our support team and if you’re lucky someone will get back to you.
What kind of files can I upload for data visualization?
CSV only at the moment with headers
How do I command the platform to create a chart?
Simply type what you want in natural language. For instance, if you want to create a bar chart of sales by region, just type "Create a bar chart of sales by region.
What types of charts can I create using this platform?
Our platform supports a wide range of chart types including line graphs, bar charts, pie charts, scatter plots, and more. The AI can suggest the best charts for your data.
How does the platform handle data security?
Your data security is our priority. Our servers only process necessary metadata. The actual data remains on your side, ensuring high-level privacy and data security.
What does the current free access offer?
Our free access allows you to explore our robust features with minor daily limitations.
What additional features will the upcoming premium plan offer?
The soon-to-be-launched premium plan will include a personal dashboard, secure storage, chart history, and more advanced features to enhance your data analysis process.
Can the platform suggest the best chart type for my data?
Yes, our AI can suggest suitable chart types based on your data. This feature is designed to help you make the most out of your data and enhance your insights.
Are there any restrictions on the size of the CSV file I can upload?
Our platform is designed to handle CSV files of various sizes. However, extremely large files might take longer to process.
Do I need any coding skills to use this platform?
Absolutely not. Our platform is designed to be intuitive and user-friendly. You can simply instruct it in natural language to create charts from your data.